
Two Approaches to Web Performance Measurement and Monitoring
Website performance can be quantified with Core Web Vitals metrics. The scores produced from these measurements help us understand where our site stands in terms of performance. Performing regular performance measurements and monitoring them can give us insight into the development of our site’s performance, so we can identify regressions or opportunities for performance improvement.
In monitoring performance, there are two approaches that can be adopted: synthetic monitoring and real user monitoring (RUM). Both have their own value and complement each other. Let’s examine each of these approaches.
Synthetic Monitoring
Synthetic monitoring means monitoring the results of site performance measurements in a controlled environment. This controlled environment is also commonly called a ‘laboratory environment’. Consistency in this controlled environment is vital to maintain in order to produce valid and reliable measurement data.
Lighthouse is one synthetic performance measurement tool
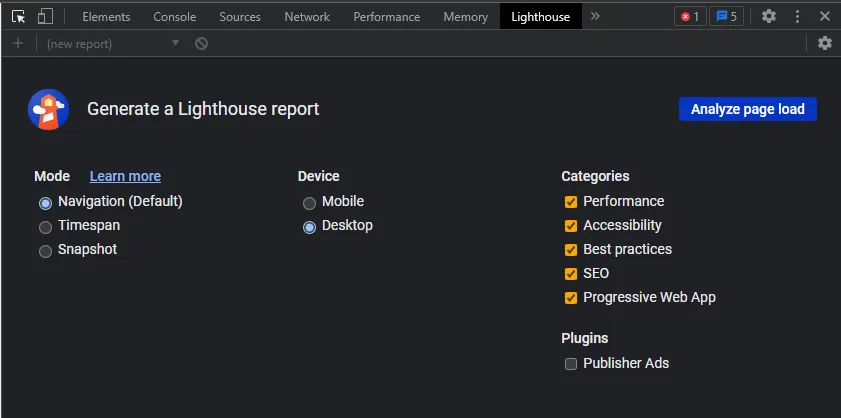
One of the most accessible examples of a synthetic performance measurement tool is Lighthouse, which is already built into Chrome’s developer tools. Lighthouse is deliberately designed to be minimal in configuration, so that its test parameters are consistent and its measurement results are reliable. Lighthouse analysis results provide many indicators, not limited to performance indicators and Core Web Vitals.
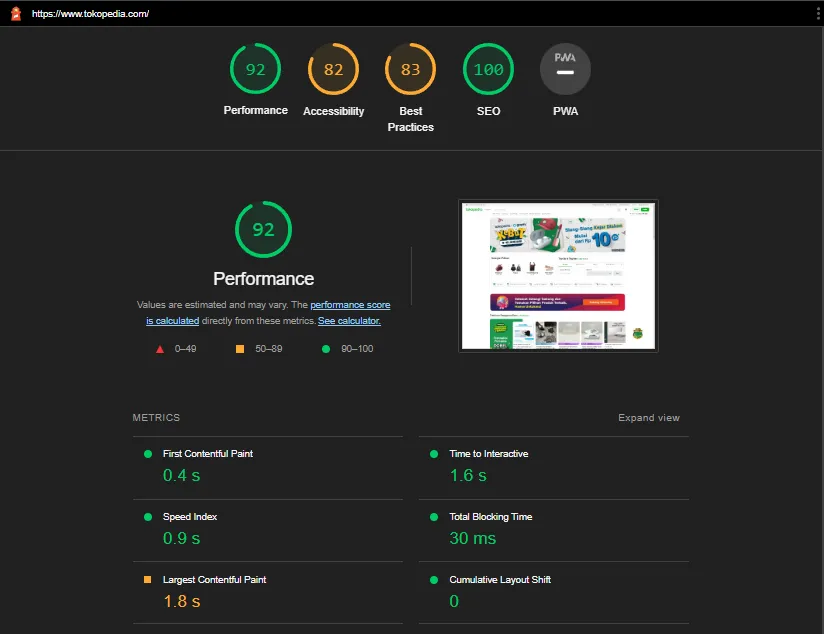
Example of Lighthouse analysis results for the www.tokopedia.com homepage
When Is Synthetic Monitoring Used?
Synthetic test results will always use consistent parameters. For example, in terms of browser version, internet speed, and CPU speed, all are simulated with throttling. This is to produce reliable measurement results, in the sense that they can be compared with other measurement results from the same environment.
Meanwhile, in reality, the production version of our site is accessed in different situations: different devices, different browsers, different internet quality, and different distances to the server. Doesn’t that mean synthetic monitoring doesn’t represent the real user experience?
Synthetic monitoring is indeed less accurate at representing real user experience. However, synthetic monitoring is useful for detecting regression or performance degradation of a site during the development stage. Imagine if a newly released feature turns out to make your site’s performance slow. If you don’t monitor, then the performance degradation will likely only be detected when there are complaints from customers. On the other hand, if you make synthetic performance measurement one of your check list items before deploying, or even merging a feature, you can detect it earlier.
Examples of Synthetic Monitoring Tools
Continuing from the previous tool example, one example of a tool for synthetic monitoring is Lighthouse CI. As implied by its name, Lighthouse CI is a tool for automating and monitoring Lighthouse analysis results integrated with continuous integration (CI). With Lighthouse CI integration, you can set when Lighthouse analysis should be run against your site, and you can monitor the trends in those analysis results.
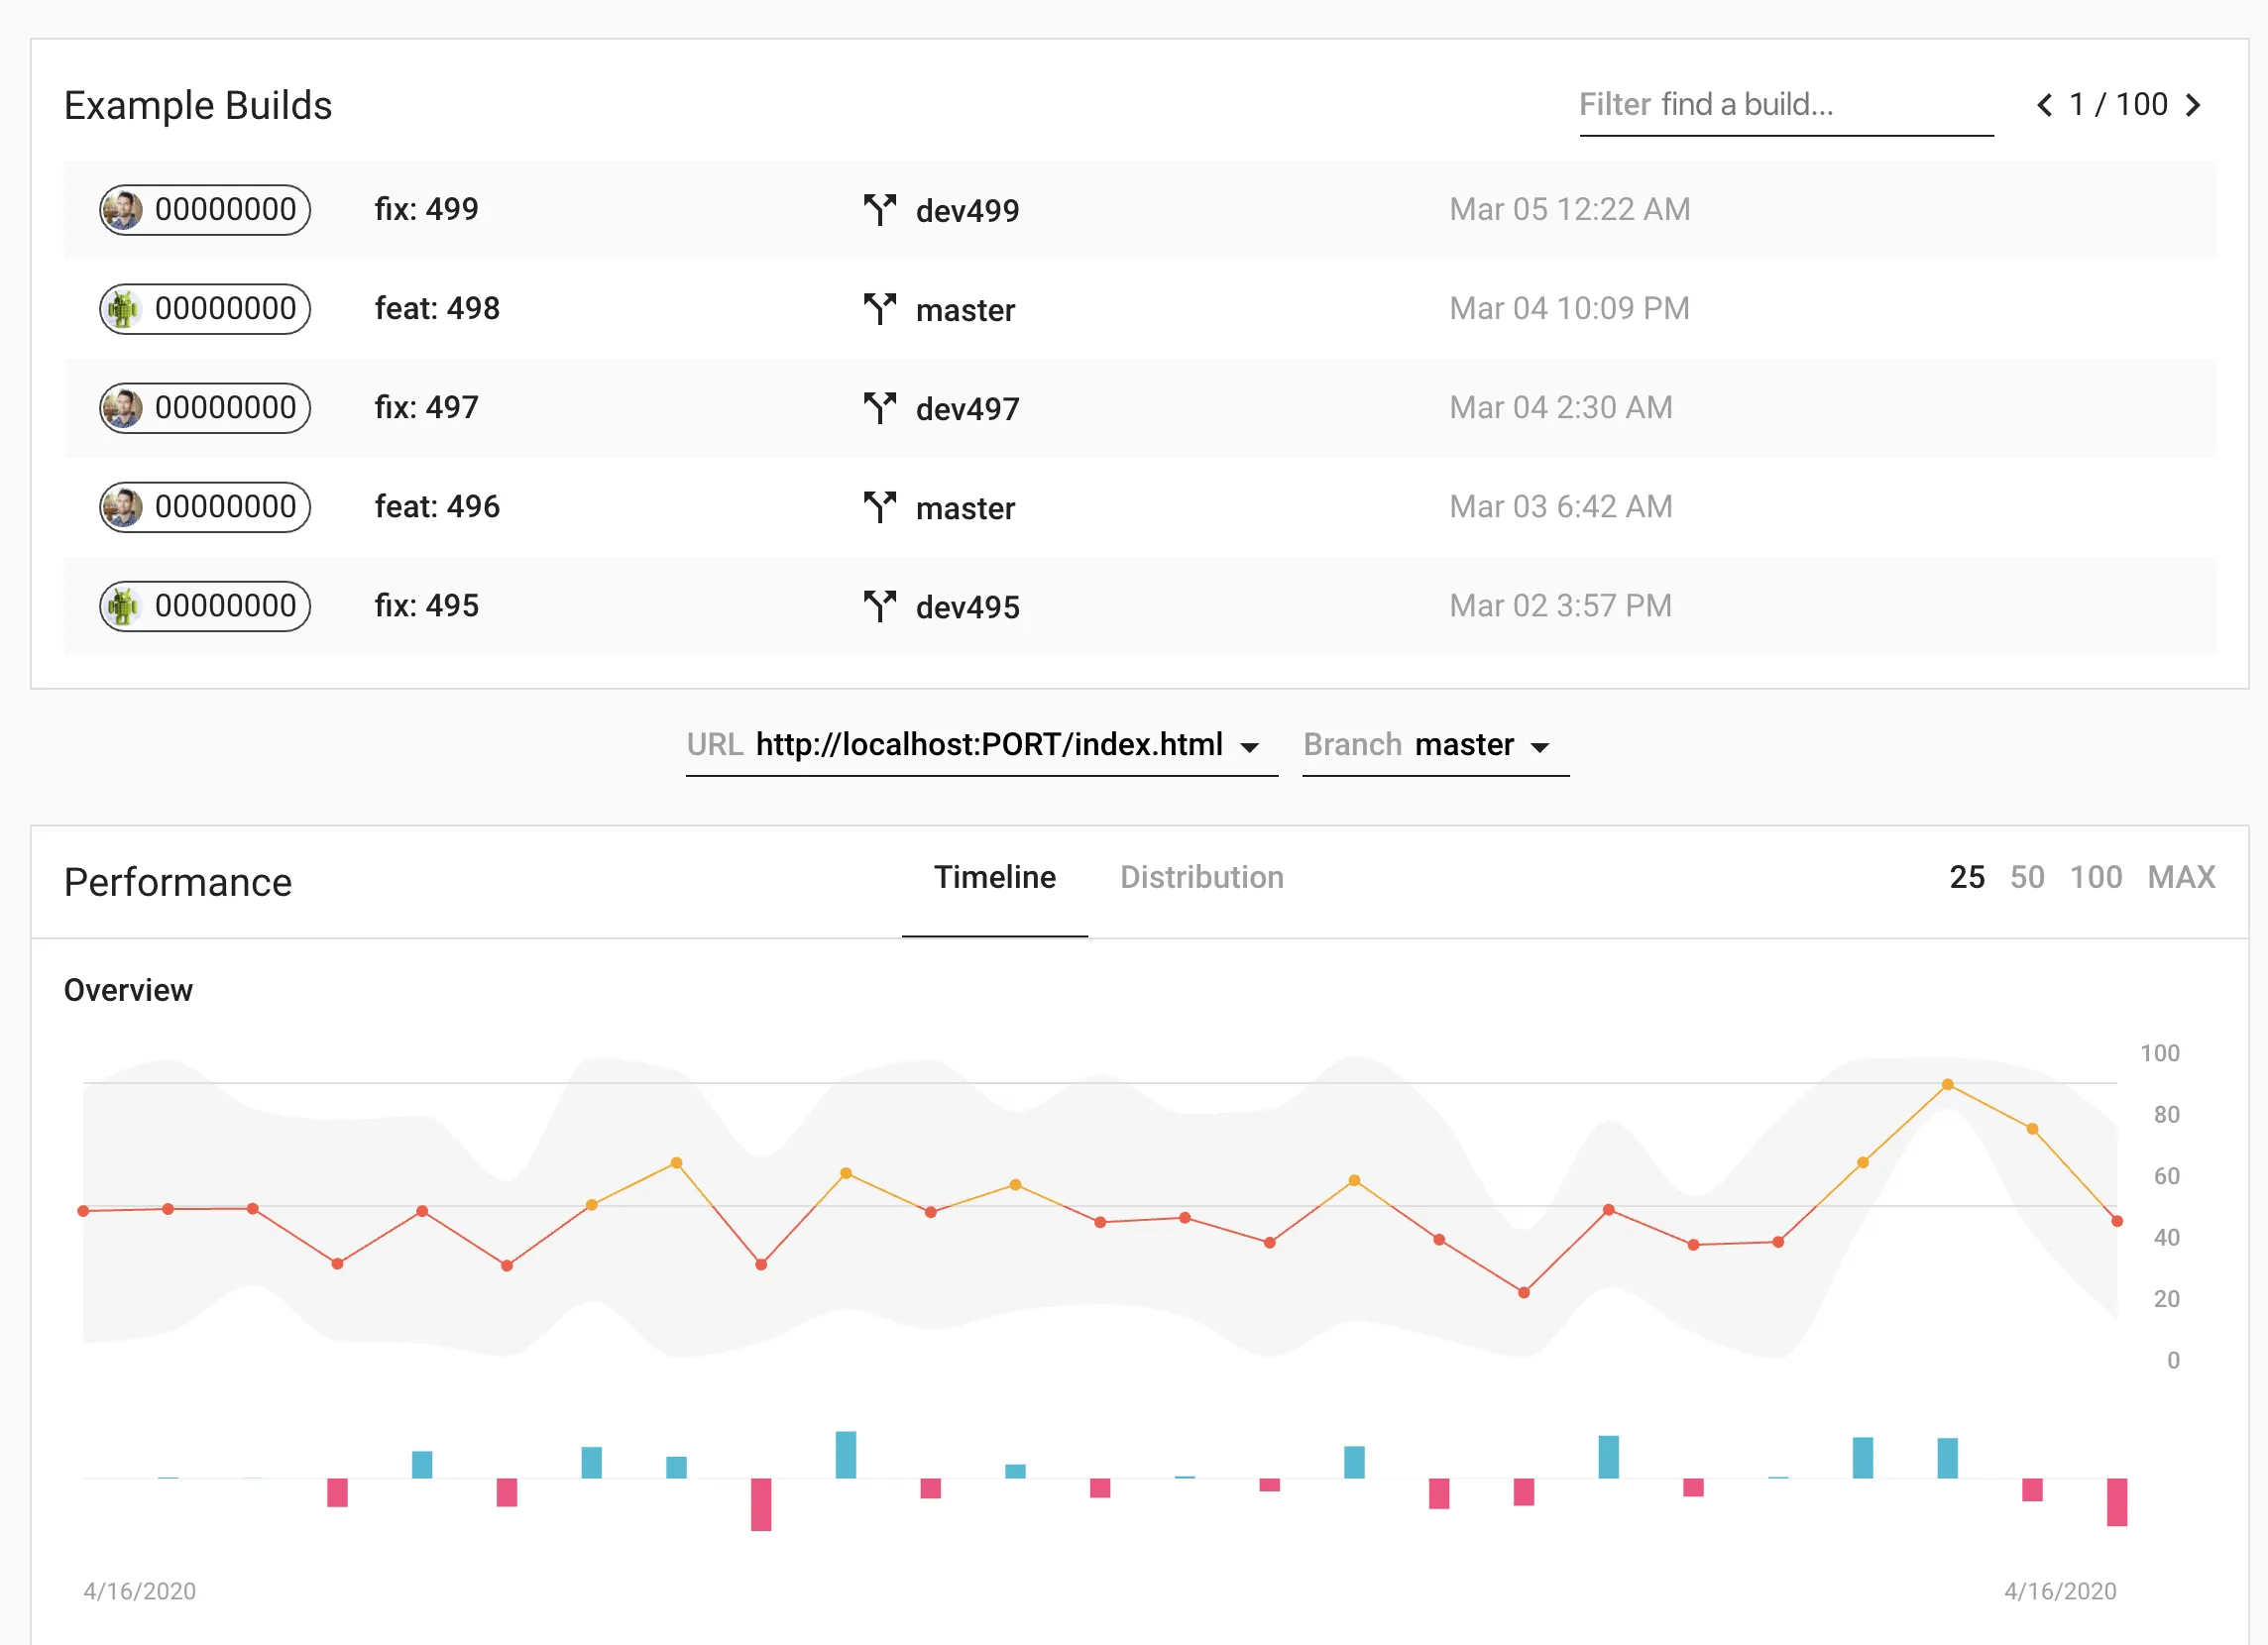
Example Lighthouse CI interface
Real User Monitoring (RUM)
Real user monitoring, also called field monitoring/measuring in the field, is the examination and monitoring of performance measurement data from real users. In the real user monitoring approach, we have users run performance measurements on their devices and automatically send the data.
The most noticeable difference between RUM and synthetic monitoring is the testing environment: if synthetic monitoring primarily tests in the development environment or staging, RUM tests in the production environment. Additionally, the variance in RUM data will naturally be larger because it is collected from real users, with various environmental variations, ranging from variations in browser, device, internet speed, to geographic location. And no less crucially, RUM data is not shaped by use cases assumed by programmers or product owners, but rather from real user behavior.
In terms of implementation, RUM monitoring will cost more than synthetic monitoring, primarily in terms of infrastructure costs. Just imagine if every user of your site sends LCP, FID, and CLS data for every page they visit. The infrastructure costs for storing and processing the data will certainly be greater than synthetic monitoring.
When Is Real User Monitoring Used?
By analyzing data from real users, the RUM approach is more representative of the user experience (UX) of our site. Data from RUM can be used to gain insight into the experience users have when visiting our site. RUM provides extremely valuable insights for organizations in understanding their users’ experience, which then helps organizations identify potential areas for development and performance optimization.
Examples of Real User Monitoring (RUM) Tools
One example of a tool that can be used for RUM is Sentry. Better known as a platform for error logging, Sentry also provides performance monitoring features with various indicators, one of which is Core Web Vitals.
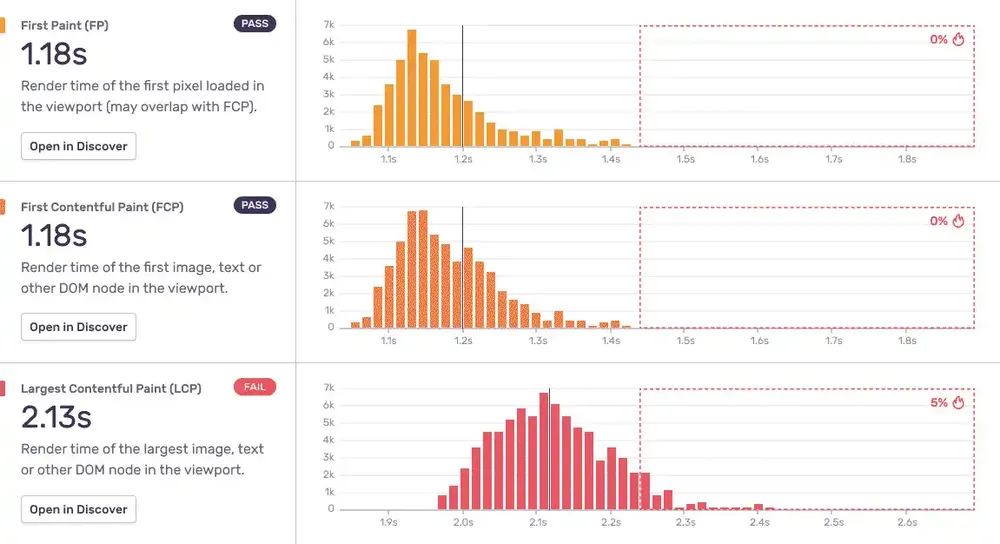
Example of Web Vitals monitoring with Sentry
In addition, we can also implement our own web vitals measurement on the user’s device with Google’s web-vitals library. The results can then be sent as a custom event to Google Analytics for monitoring. This option has the advantage of flexibility in implementation, for example, on which pages we should send data, which metrics’ data need to be sent, and so on. However, it naturally requires more effort, which means greater costs to implement.
So, Which One to Choose?
Ideally, both approaches are used in tandem.
If you only rely on RUM, you will only learn about a degradation after users have experienced it, and you will have difficulty finding out exactly when the performance regression occurred.
If you only rely on synthetic monitoring, you will have difficulty knowing what the real user experience of your site is like, as the performance of the device or environment very likely differs from your laboratory test parameters.