
Measuring Website Performance with Core Web Vitals
“Measure what is measurable, and make measurable what is not so” - (not) Galileo Galilei
Web performance is closely linked to business performance. Based on a Deloitte study commissioned by Google[1] of 37 mobile sites belonging to leading businesses in Europe and the United States, improvements in mobile site speed delivered very significant benefits. Three main points were highlighted: First, faster sites get more customers to checkout; Second, faster sites keep users engaged longer and lead to more purchases — a 0.1-second speed improvement increases conversion rates by up to 8.4% on retail sites and 10.1% on travel sites; Third, faster sites have a lower bounce rate.
Improving web performance opens up opportunities to improve the business performance of our organization/company. However, in order to improve performance, we must first be able to measure our site’s own performance quantitatively. Google offers a collection of metrics that can be used as a benchmark for web performance called Web Vitals. Among the Web Vitals metrics, there is a subset of metrics considered the most important, called Core Web Vitals.
Core Web Vitals
Core Web Vitals are a subset of Web Vitals metrics that are prioritized because they represent the user experience in the real world. The metrics included in Core Web Vitals are dynamic and can change as technology evolves in the future. Even so, Google guarantees that Core Web Vitals are stable, that any changes will be communicated well in advance, and that changes will follow a predictable pattern.
Those included in the latest version of Core Web Vitals (2020) are Largest Contentful Paint (LCP), First Input Delay (FID), and Cumulative Layout Shift (CLS). These three metrics represent three different aspects of performance, where LCP represents loading performance, FID represents interactivity performance, and CLS represents visual stability performance.
Largest Contentful Paint (LCP)
Largest Contentful Paint measures the time it takes for the browser to finish rendering the element with the largest dimensions in the viewport. Only elements considered as content are evaluated, including <img>, <image> inside <svg>, <video>, elements with a background image loaded via url(), and block-level elements containing text or inline text elements within them.
The LCP metric measures how long a website takes to load until it displays content that is useful to the user. Before LCP, the widely used metric was FCP (First Contentful Paint), which measures the time a website takes to render the first piece of content. FCP may not accurately represent performance because the first content seen by the user is not necessarily useful content, such as a splash screen or spinner indicating a loading process. Therefore, the element with the largest dimensions is chosen as the performance indicator.
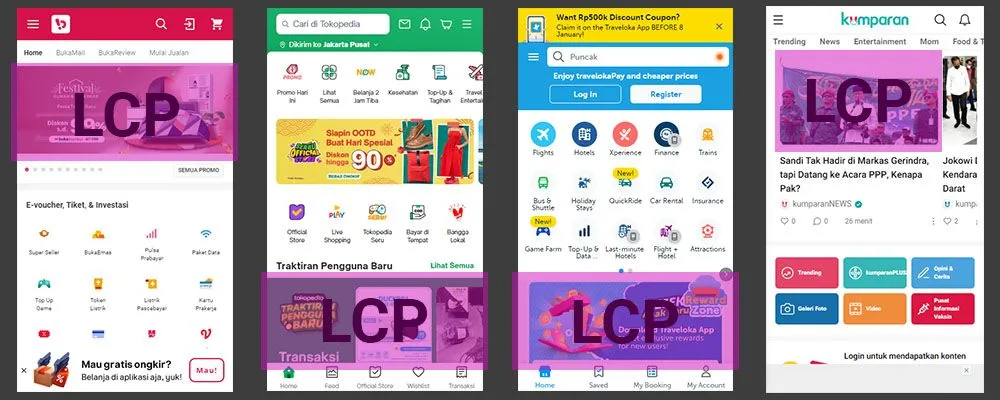
LCP illustration on the Bukalapak, Tokopedia, Traveloka, and Kumparan websites
As a page’s content loads, the browser will continuously record new elements that can be considered LCP, along with their timestamps. The browser will stop recording new LCP entries when the user interacts with the page, for example by scrolling, because that could change the visible content.
Evaluating LCP

LCP value spectrum. Source: web.dev.
A good LCP value is under 2.5 seconds, while between 2.5 and 4 seconds is considered in need of improvement, and anything beyond that is a poor value.
First Input Delay (FID)
First Input Delay measures the duration between the first time a user interacts with a page — for example by following a link — and the moment when the browser can process that input. The interval between user interaction and its processing may occur especially during initial loading, because the browser’s main thread is busy handling many things. During initial loading, the browser may be requesting assets such as CSS and JS, which block the main thread.
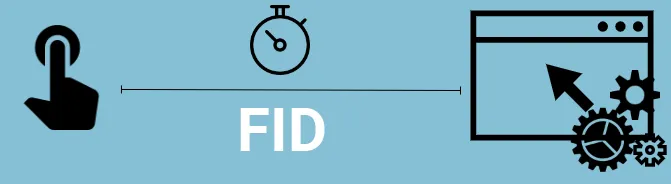
FID calculation illustration
FID does not measure the duration of input processing, nor does it measure how long the browser takes to provide feedback through interface changes. FID only measures the interval between the input event and the time when processing begins. It is designed this way to prevent developers from gaming the measurement with techniques that produce good scores but are actually bad for the user experience. For example, separating input processing with setTimeout() to make it seem like input processing runs faster, when in reality the actual process is offloaded to another task in the stack.
The FID number represents the responsiveness of the page when a user tries to interact with it. Why measure only the first input? Because the first input will be the user’s first impression of our site. Additionally, the greatest potential for processing delays occurs at the beginning of loading, when the browser is busy preparing the page to be served.
To measure FID, authentic user input is required. Therefore, FID can only be measured with real user data — you won’t find FID in Lighthouse. Analyzing the resulting data must also be done carefully, because the data variance will be large due to the diversity of real-world scenarios: some users click a link before the page has finished loading, some click only after the page is fully loaded, and some don’t interact with the page at all. Therefore, Google recommends that the data analyzed be taken from higher percentiles, between the 95th and 99th percentiles.
Evaluating FID

FID value spectrum. Source: web.dev.
The FID value spectrum is as follows: under 100 ms is considered good, up to 300 ms needs improvement, and anything beyond that is poor.
Cumulative Layout Shift (CLS)
Have you ever visited a website, found something interesting to click, and then just as you positioned your cursor over it and pressed the mouse button, the element you wanted to click shifted position, causing you to click something else instead? If you have, you know how bad that experience feels. That phenomenon is called a layout shift.

Layout shift illustration
Cumulative Layout Shift is a metric that represents the largest burst of layout shifts that occurs throughout the lifetime of a page. A series of layout shift events is grouped into several session windows. Each session window contains recordings of layout shifts that occur within an interval of at most one second between events, with a maximum duration of 5 seconds per window.
Each recorded layout shift entry has a score calculated based on two variables: impact fraction and distance fraction. The formula is straightforward, as follows:
Layout shift score = impact fraction * distance fraction
Impact fraction, as the name suggests, represents the impact of the layout shift on the viewport. Its value is derived from the combined ratio of the viewport area affected before and after the shift. Meanwhile, distance fraction represents the distance of movement of the unstable element. The distance fraction variable was introduced to produce a balanced assessment. Without it, a small movement of a large element would produce an excessively large score, not representative of its actual impact. To find the distance fraction score, we first take the farthest distance the element moved, either horizontally or vertically. Then, that distance is divided by the largest dimension of the viewport, either horizontal or vertical. It’s easier to illustrate as shown below:
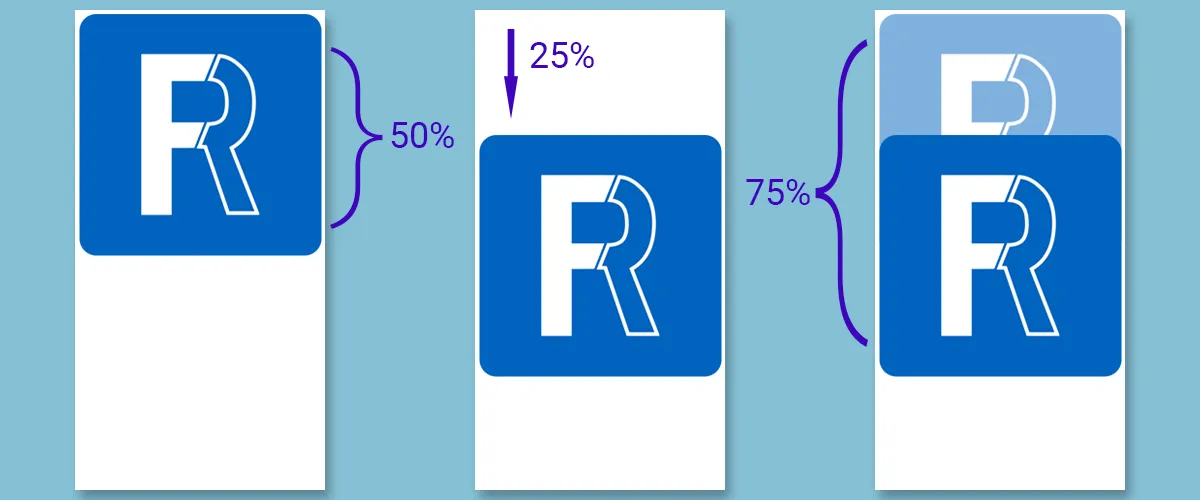
In the example above, there is an element that fills 50% of the viewport. The largest viewport dimension is along the vertical axis. The element shifted 25% of the vertical viewport dimension downward, but did not move sideways at all. Therefore, we can conclude its distance fraction is 0.25. Meanwhile, the combined viewport area affected before and after the shift amounts to 75%, so the impact fraction value is 0.75.
We can conclude that this layout shift event has a score of 0.75 * 0.25 = 0.1875.
Of all the layout shifts that occur throughout the performance measurement period, only the highest score is taken as the CLS score. Some testing tools measure the total layout shift score that occurred, but that is now considered a legacy method.
The layout shifts counted by the browser are unexpected layout shifts. That is, if a layout shift is a response to user input, its score will not be included in the CLS calculation. The browser determines this by checking whether there was any user input within the past 500 ms.
Evaluating CLS

CLS value spectrum. Source: web.dev.
A CLS value categorized as ‘good’ is below 0.1, a value up to 0.25 means improvement is needed, while anything higher than that can be considered poor.
With Core Web Vitals metrics, we can quantify the user experience. However, it’s important to remember that the ultimate value of performance metrics and standards is not the goal itself. They are not meant to be conquered, but rather they serve as tools to assess improvements or regressions in our site’s user experience.